Paper of the month: First direct experimental evidence of CNO neutrinos
January 16, 2021 by RebecaBV
Stars are fueled by and evolve through nuclear fusion reactions. For stars in the main sequence, the key process in their cores is the fusion of hydrogen into helium. To describe what is happening inside the star, there are two well known mechanisms that, depending on the star mass range, can give us an understanding of the process. For Sun-like stars, the leading reaction is the proton-proton chain (pp-chain), while for stars that are more than 1.3 times as massive as the Sun, the leading one is the Carbon-Nitrogen-Oxygen (CNO) cycle, see Fig.1.
Briefly, the pp-chain creates 4He through different channels. On the other hand, the CNO cycle reaction uses carbon, nitrogen and oxygen as catalysts and it is more complicated than the pp-chain, see the right panel of Fig.1. Other characteristics besides the star mass should be considered, as the temperature and the relative abundance of elements within its core (metallicity). From these two vague views of the two processes, it is evident that both of them are sources of electron neutrinos. Those neutrinos constitute a fundamental tool to probe the existence of these nuclear reactions inside stars.
While the pp-chain has already been observed directly [1], there were no experimental evidence of the existence of the CNO cycle until the Borexino collaboration recently announced its results, which imply a step towards confirming the overall solar picture and provide some hints to the solution to the solar metallicity problem. Borexino is a large volume liquid scintillator experiment, located underground at the Laboratori Nazionali del Gran Sasso, in Italy. In Borexino, neutrino interactions occur via elastic scattering with electrons. When electrons deposit their energy in the scintillator, a small flash of light is collected by the photomultiplier tubes (PMTs). The CNO Borexino analysis was performed by treating the three CNO neutrino components as one single contribution. The [780, 885] keV energy region of interest (ROI), highlighted by a yellow band in Fig. 2, represents the region with the largest signal-to-noise ratio for CNO neutrinos. The main difficulties in the extraction of the CNO signal are its similarity with the recoil electron spectrum coming from pep neutrinos interactions, together with the 210Bi background. The pep rate can be constrained by several assumptions while, in order to keep the 210Bi background under control, an active temperature control system was installed, lowering this background rate to 11.5±1.3 counts per day (cpd) in 100 tonnes of scintillator.
Results from a multivariate analysis showed a 5.1σ significance on the observation of solar neutrinos coming from the CNO cycle. The best fit value is 〖7.2〗_(-1.7)^(+3.0) cpd per 100 tonnes at 68% confidence level (CL), corresponding to a solar neutrino flux on Earth of 〖7.0〗_(-2.0)^(+3.0)×〖10〗^8 m-2 s-1. A test based on a profile likelihood statistics disfavours the absence of a CNO signal with a significance of 5.0σ.
A cross-check of this analysis was performed with a counting analysis, consisting on a simple count of events inside the ROI region and substracting the contributions due to known backgrounds in order to reveal the CNO signal. With this method the CNO rate obtained is of the order of 5.6±1.6 cpd per 100 tonnes, confirming the presence of CNO neutrinos at the 3.5σ level. Overall, this result has represented the first experimental evidence of this reaction sequence in a star.
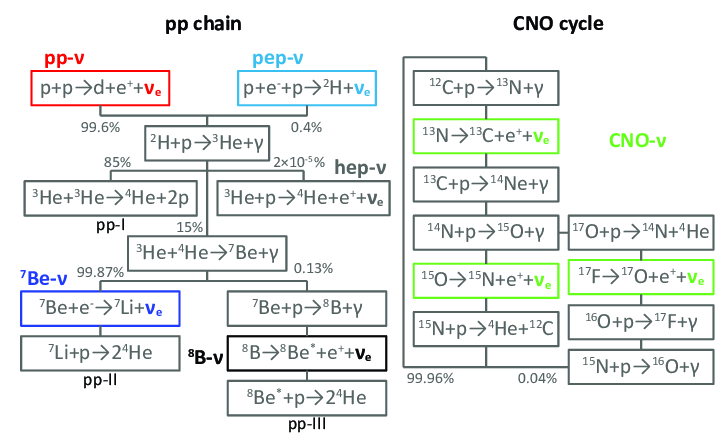
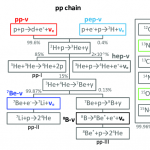
Fig.1: Schemes of pp-chain (left) and CNO cycle (right).
.png)
Fig.2: Energy distribution of Borexino events (black points) and spectral fit (pink). CNO-ν, 210Bi, and pep-ν are highlighted in solid red, dashed blue, and dotted green, respectively. All other components are in grey. The yellow band represents the region with the largest signal-to-background ratio for CNO-ν (ROI).
REFERENCES
[1] M. Agostini et al. Nature, 562(7728):505–510, 2018.
This project has received funding /support from the European Union's Horizon 2020 research and innovation programme under the Marie Skłodowska -Curie grant agreement No 860881-HIDDeN
© HIDDeN PROJECT 2023